Dashboard
Your DNS security overview — provider status, issue severity breakdown, recent changes, and activity feed at a glance.
The Dashboard is the first page you see after signing in. It provides a high-level overview of your DNS security posture and recent activity across all connected providers.
Workflow overview
The top section shows key metrics at a glance:
- Providers — number of connected DNS providers and their status
- Zones — total zones discovered across all providers
- Records — total DNS records synced
- Issues — open security issues grouped by severity
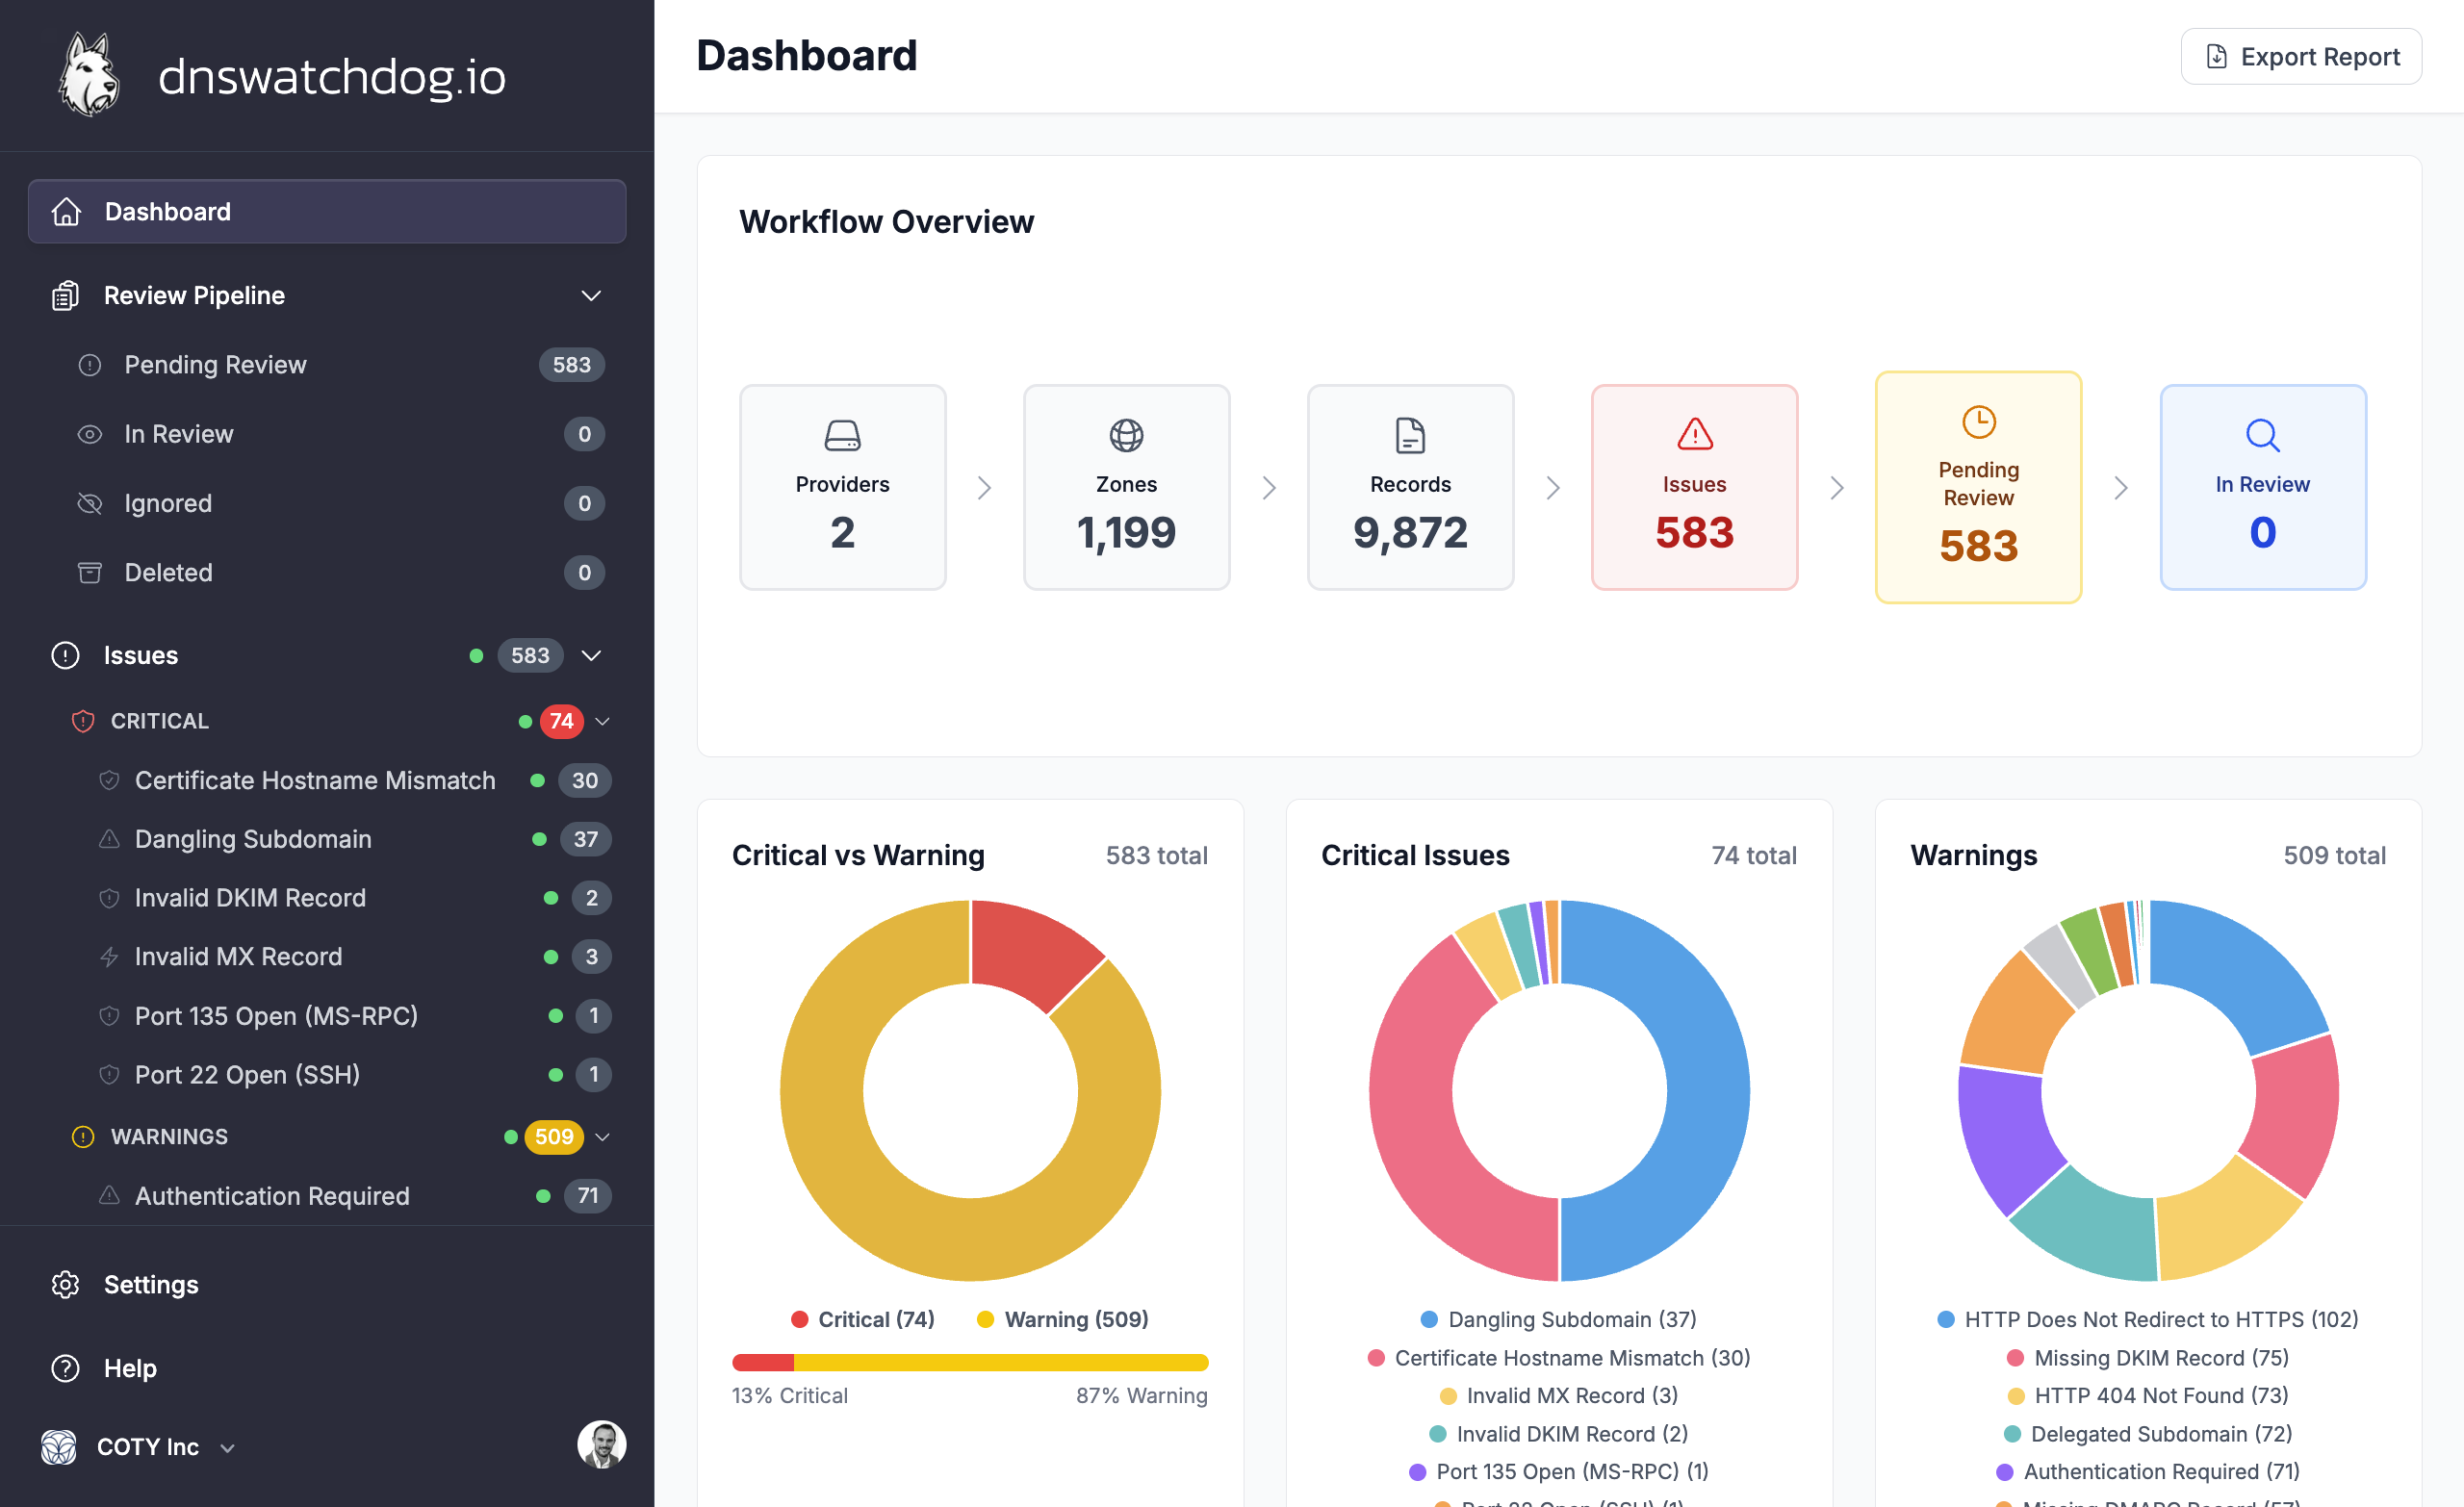
Issue severity charts
Three charts visualise your current issue landscape:
- Critical vs Warning — overall distribution of issue severity
- Critical Issues — breakdown of critical issues by type (e.g. expired certificates, dangling subdomains, exposed ports)
- Warnings — breakdown of warning-level issues by type
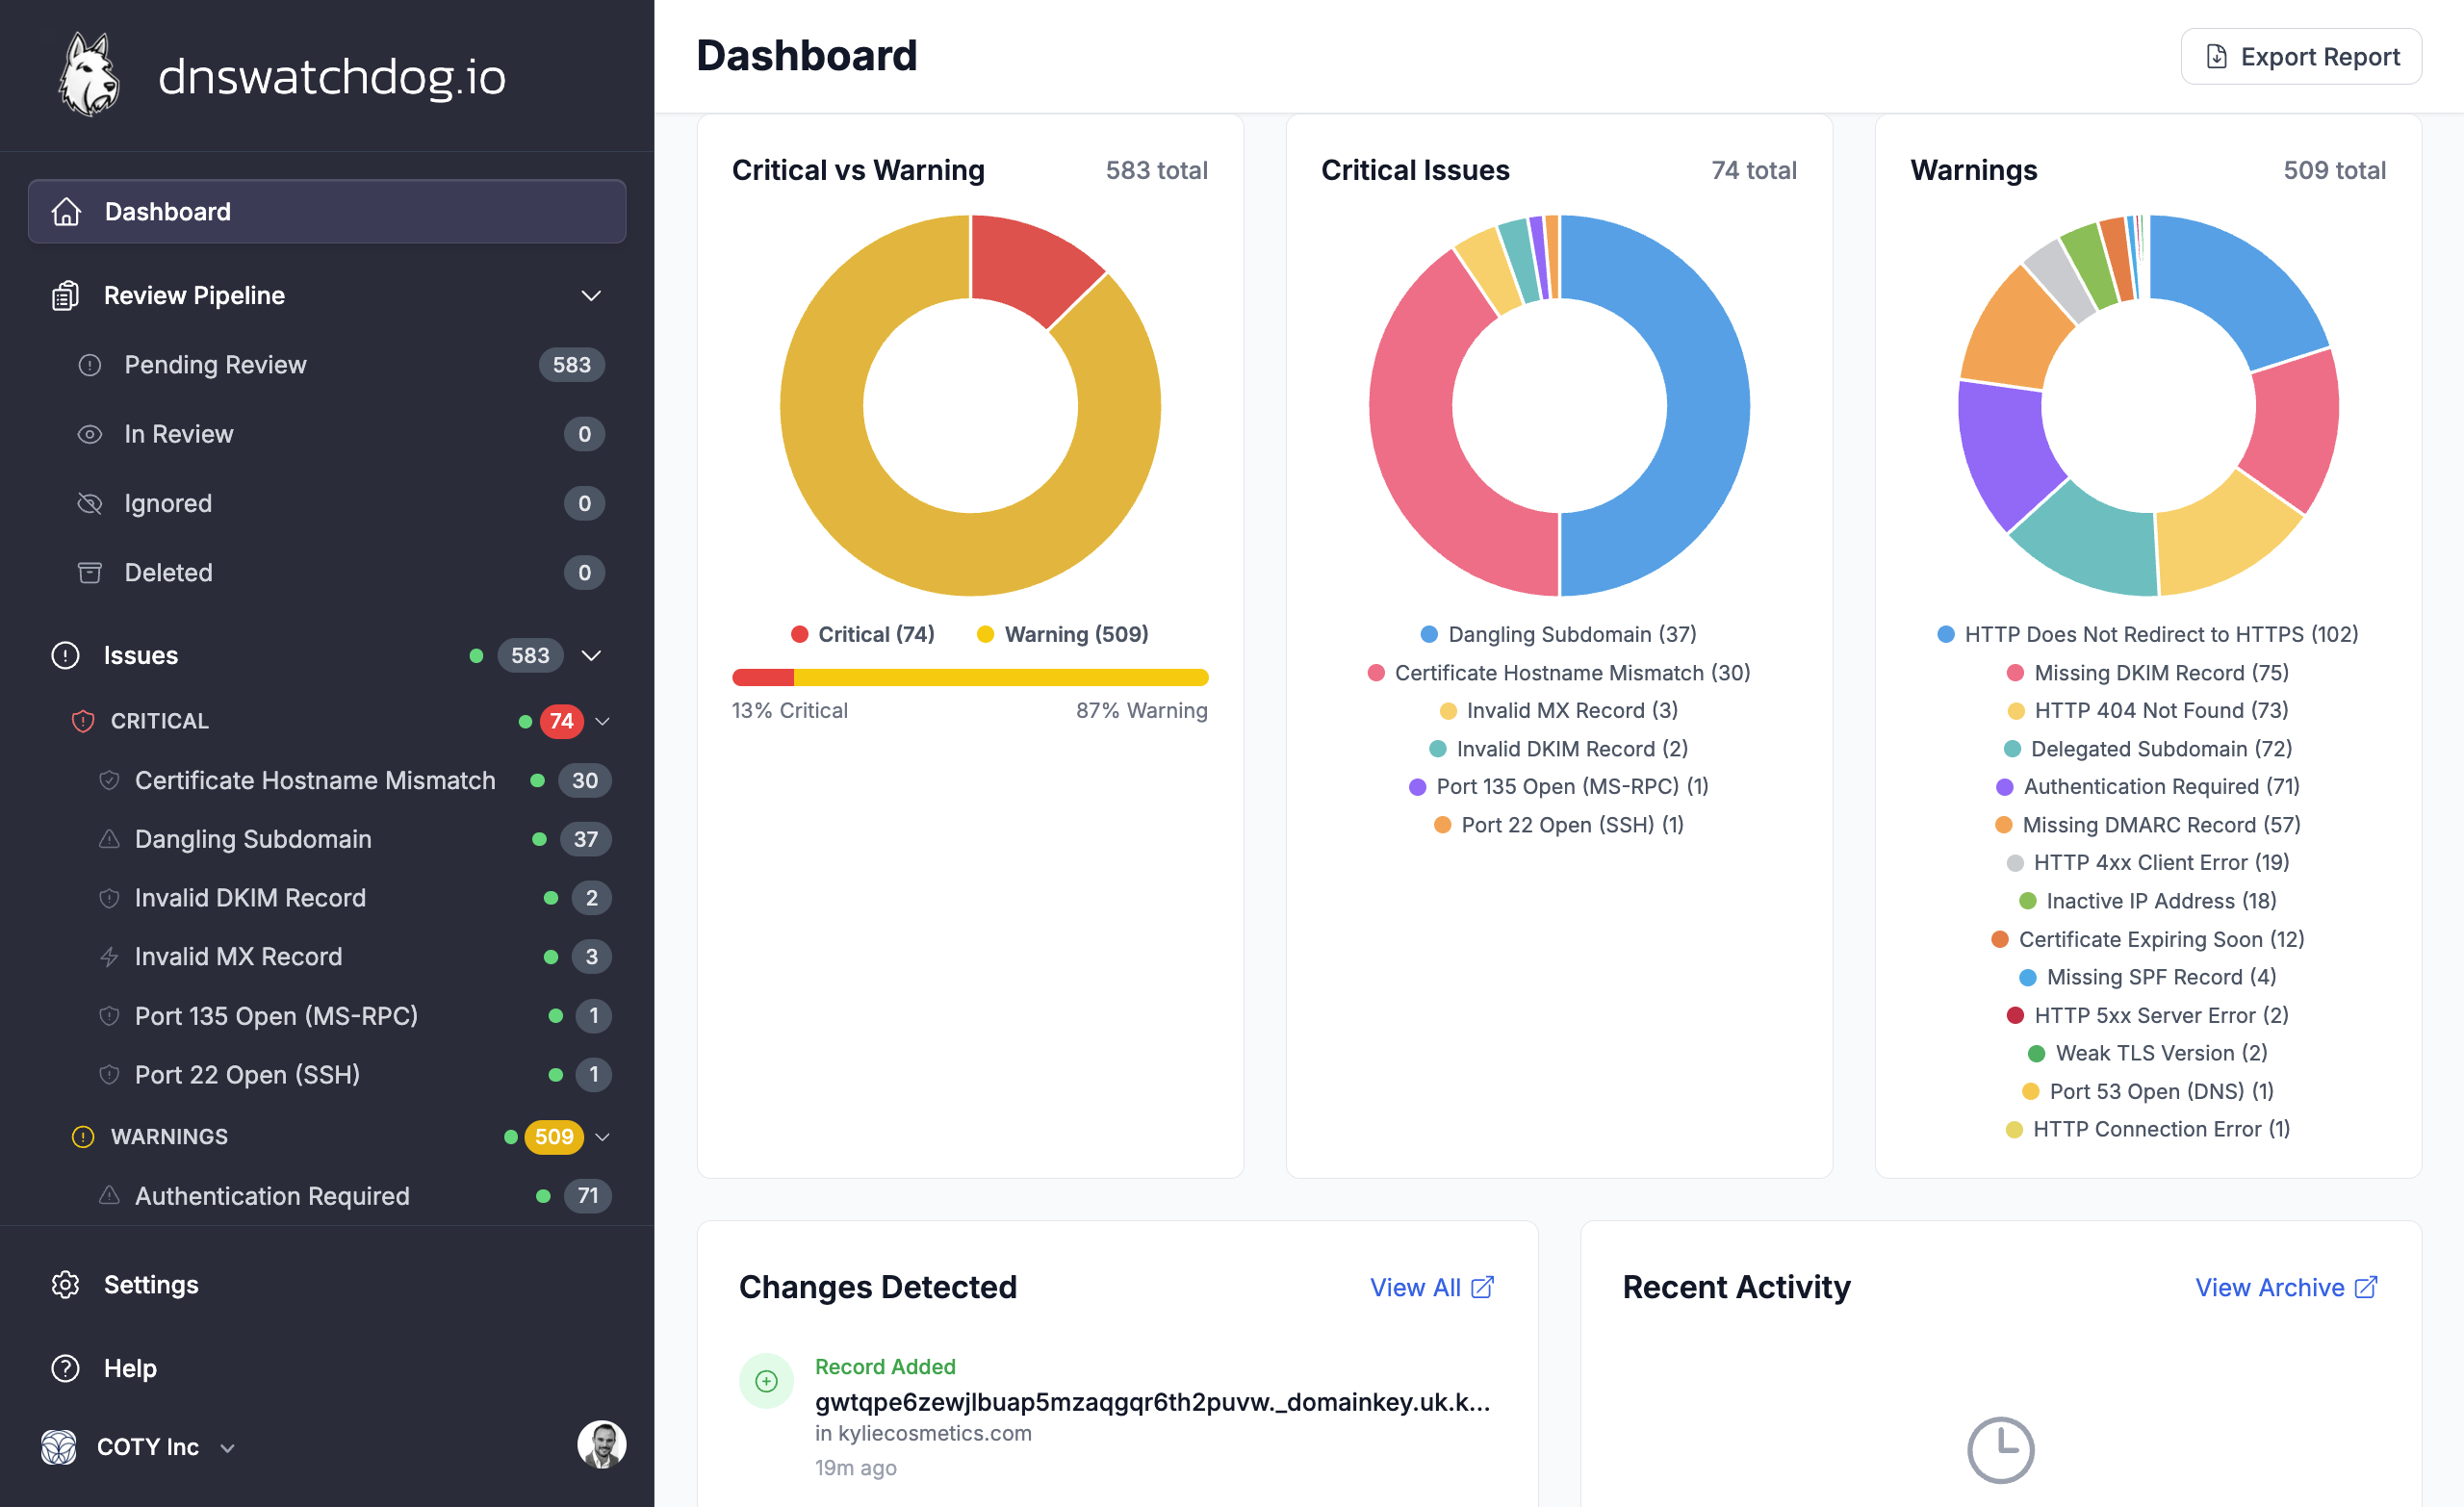
Clicking a chart segment navigates directly to the Issues page filtered by that issue type.
Recent changes
The Recent Changes panel shows the latest DNS changes detected during scans — new records, modified values, deleted records, and new or resolved issues. Each entry links to the full changelog for that scan.
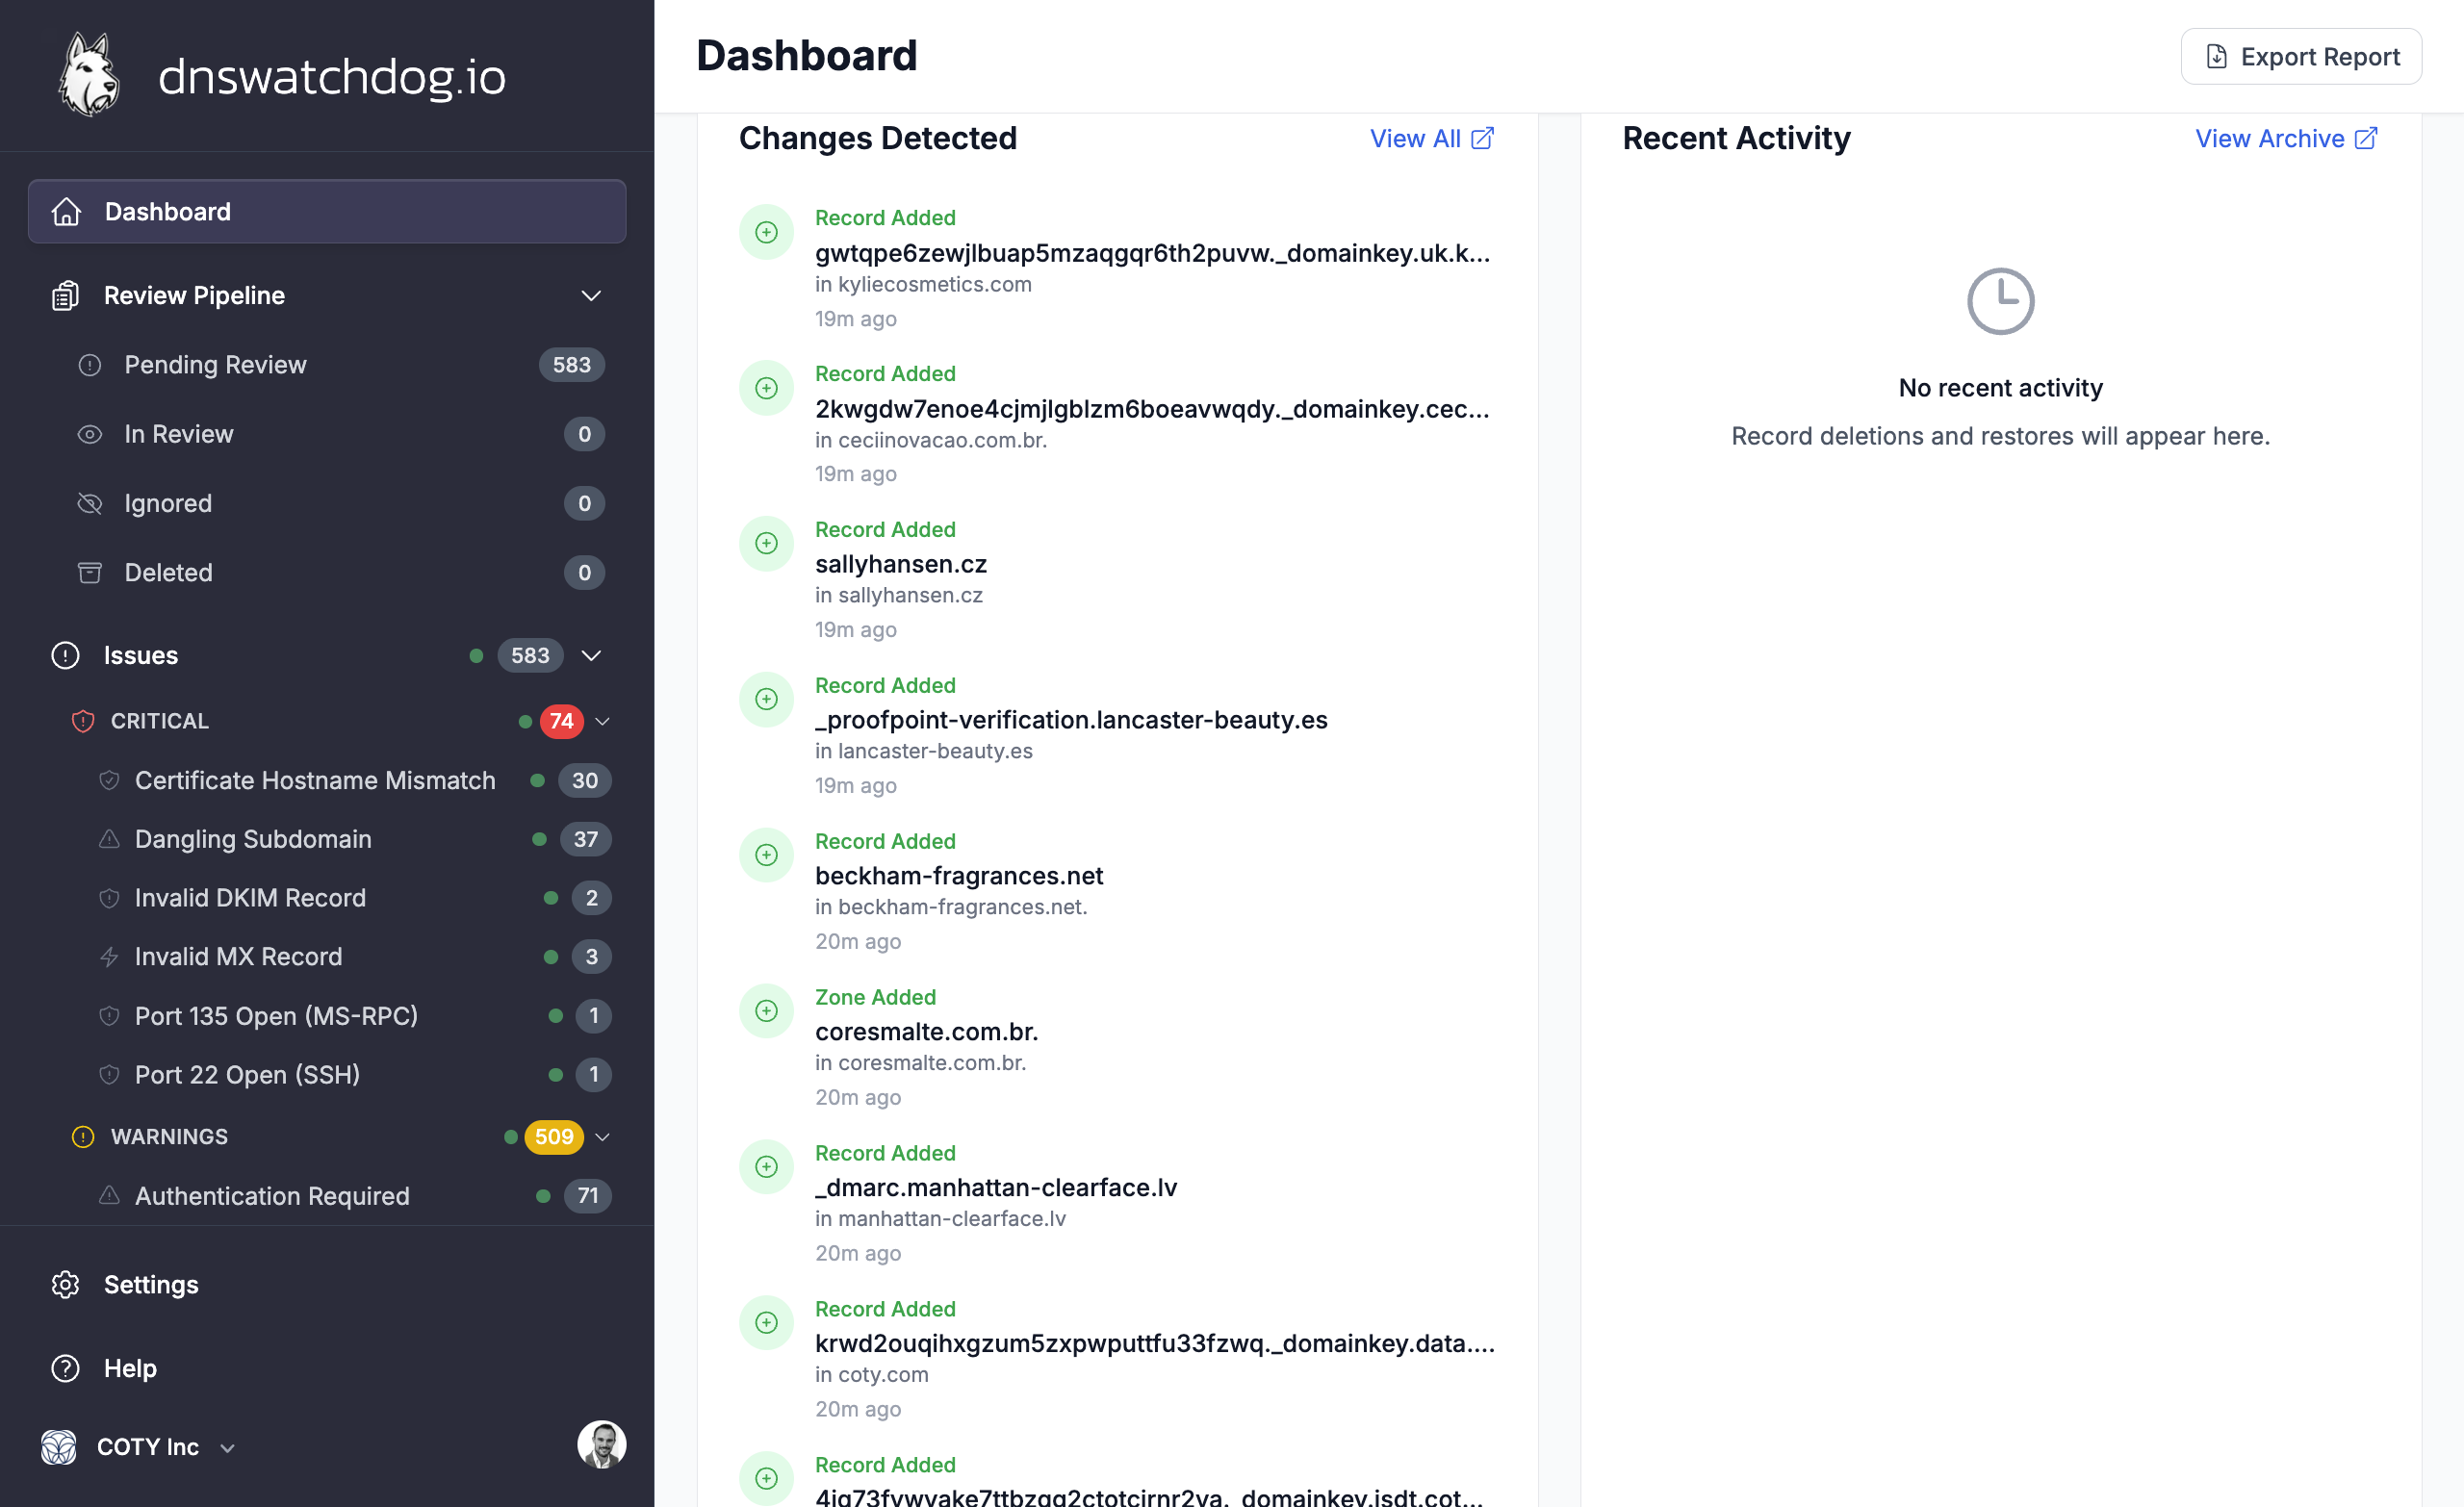
Recent activity
The Activity feed shows recent actions taken by your team — provider connections, record archives, issue status changes, and manual rescans.
Alerts
When something needs attention, the dashboard displays alert banners:
- No providers configured — prompts you to connect your first DNS provider
- Provider in error state — a provider's credentials have expired or are invalid
- Provider syncing — a provider sync is currently in progress
Inventory
Exploring your DNS inventory — providers, zones, records, certificates, IP addresses, web forwards, and screenshots.
Providers
View and manage your connected DNS providers — see connection status, zone counts, sync history, and credential health for Route 53, Cloudflare, CSC, Azure DNS, Google Cloud DNS, and UltraDNS.